North Carolina State University
All Respondents
This overview report presents information provided by supervisors of NC State alumni. It includes background information on employers, supervisors’ evaluation of how important various knowledge and skills are to occupational positions, and their assessment of the NC State alumni's actual knowledge and skills. For additional information about the survey methods and analysis, see "Fall 1998 Survey of Baccalaureate Alumni and Employer Surveys: Introduction, Methods, and Demographic Profile". When reading this report it is important to remember that the 416 supervisors responding represent only 14.6 percent of the employed alumni respondents.
Table of Contents:
Employer Background Information:Employer Background Information
Type of Organization (Table 4-1)
Supervisors indicated which of several general organization types best described their company or agency. Slightly more than one-third (38.1%) of the alumni for whom we have employer information have a position in industry. Approximately equal numbers work in academic (20.5%) and governmental (20.2%) institutions. Only 2.3 percent have obtained employment in religious and/or non-profit organizations, while the remainder (18.8%) work for professional service organizations.
Table 4-1. Type of Organization
|
Organization type |
Number |
Percentage |
|
Industry |
130 |
38.1% |
|
Academic |
70 |
20.5% |
|
Government |
69 |
20.2% |
|
Professional Service |
64 |
18.8% |
|
Religious/ Nonprofit |
8 |
2.3% |
Number of Employees
(Tables 4-2 and 4-3)Employers indicated the number of employees at the NC State alumni’s site. A majority (53.8%) said their site employs less than 100 full-time workers. About 10 percent, however, employ 1000 or more full-time workers. Less than half of the employers (41.2%) reported having any part-time workers; 21.6 percent said they had fewer than 10 part-time workers.
Table 4-2. Number of Full-Time Employees
|
Total Number of Full Time Employees |
Number |
Percentage |
|
Less Than 10 |
58 |
14.4% |
|
10-19 |
55 |
13.6% |
|
20-49 |
50 |
12.4% |
|
50-99 |
54 |
13.4% |
|
100-199 |
54 |
13.4% |
|
200-499 |
52 |
12.9% |
|
500-999 |
36 |
8.9% |
|
1,000-9,999 |
40 |
9.9% |
|
10,000+ |
4 |
1.0% |
Table 4-3. Number of Part-Time Employees
|
Total Number of Part Time Employees |
Number |
Percentage |
|
None |
237 |
58.8% |
|
Less Than 10 |
87 |
21.6% |
|
10-19 |
23 |
5.7% |
|
20-49 |
25 |
6.2% |
|
50-99 |
19 |
4.7% |
|
100-199 |
0 |
0.0% |
|
200-499 |
6 |
1.5% |
|
500-999 |
5 |
1.2% |
|
1,000-9,999 |
1 |
0.2% |
|
10,000+ |
0 |
0.0% |
Number of Employees with a Title or Position Identical to Alumni's
(Table 4-4)Approximately one-fourth (24.6%) of supervisors said no other employees at their site hold a job title or position similar to that of the NC State graduate. Slightly less than half (45.3%) said there are fewer than ten other employees with the NC State alumni’s job title or position. However, 4.5 percent of the 406 responding employers indicate that their NC State graduate employee shares a title or position with 200 or more co-workers.
Table 4-4. Number of Employees with a Title or Position Identical to Alumni’s
|
Number of Employees with Identical Title |
Number |
Percentage |
|
None |
100 |
24.6% |
|
1-9 |
184 |
45.3% |
|
10-19 |
41 |
10.1% |
|
20-49 |
28 |
6.9% |
|
50-99 |
21 |
5.2% |
|
100-199 |
14 |
3.4% |
|
200-499 |
10 |
2.5% |
|
More than 500 |
8 |
2.0% |
Other NC State Alumni Employees
(Tables 4-5 and 4-6)The majority (85.2%) of respondents reported that they have at some point hired other NC State graduates. At the time of the survey, about one-third (32.2%) of the supervisors said their site employed no NC State graduates other than the alumni in question and another 30.6 percent said they currently employ only two to four NC State alumni. Almost 10 percent (9.6%) of the respondents, however, employed 20 or more NC State alumni.
Table 4-5. Ever Hired Other NC State Alumni
|
Yes, Has Hired other NC State Alumni |
||
|
Number |
Percentage |
|
|
Organization has hired other NC State graduates |
294 |
85.2% |
Table 4-6. Number of NC State Graduates Employed at this Site
|
Number of NC State Alumni Employed |
Number |
Percentage |
|
Only this Alumnus |
118 |
32.2% |
|
2-4 |
112 |
30.6% |
|
5-9 |
64 |
17.5% |
|
10-19 |
37 |
10.1% |
|
20-99 |
22 |
6.0% |
|
100 or more |
13 |
3.6% |
Employee Background Information
Respondents were asked about the educational requirements for the alumnus’ position, their familiarity with the alumnus, the adequacy of his/her preparation, and his/her promotion record.
Minimum Educational Requirements for the Employee’s Position
(Table 4-7)Over three-fourths (83.0%) of respondents reported that the position required at least a Bachelor’s Degree.
Table 4-7. Minimum Educational Requirements for the Employee’s Position
|
Minimum Educational Requirements for Graduate’s Position |
Number |
Percentage |
|
High School Diploma or Less |
25 |
6.1% |
|
Certificate Program or One Year of College |
6 |
1.5% |
|
Associate Degree or Two Years of College |
38 |
9.3% |
|
Bachelor’s Degree |
313 |
76.9% |
|
Graduate Degree |
25 |
6.1% |
Supervisor Familiarity with Alumni
(Tables 4-8 and 4-9)The survey asked supervisors to evaluate the alumni employees’ skills and knowledge. Since supervisors’ familiarity with employees may affect assessment, we also asked supervisors how frequently they had contact with the NC State alumnus and how many years they had known him/her.
Responding supervisors had frequent contact with the NC State alumni. Almost three-fourths (71.6%) reported having daily contact with the alumnus. However, half (49.5%) of the employers reported having known him/her less than two years, and 18.6 percent had known this employee for less than 1 year.
Table 4-8. Frequency of Contact with Alumni
|
Frequency of Contact with Graduate |
Number |
Percentage |
|
Daily |
292 |
71.6% |
|
Several times a week |
95 |
23.3% |
|
Several times a month |
21 |
5.1% |
Table 4-9. Number of Years the Employer has Known the Employee
|
Years Employer has Known Employee |
Number |
Percentage |
|
Less than 1 year |
76 |
18.6% |
|
1 - 1.9 years |
126 |
30.9% |
|
2 - 2.9 years |
79 |
19.4% |
|
3 – 3.9 years |
60 |
14.7% |
|
4 - 4.9 years |
32 |
7.8% |
|
5 - 9.9 years |
22 |
5.4% |
|
10 or more years |
13 |
3.2% |
Supervisor Evaluation of Professional Preparation
Supervisors were asked to rate the importance of various skills and abilities for the NC State graduates’ occupational position, and how these employees’ actual knowledge and skills compares to that of employees holding comparable positions. These cover eight general categories of knowledge and skill items: communications skills; overall knowledge of computer applications; technical knowledge; using knowledge to solve problems; traits; work attitudes and skills; professional development; and academic background. Supervisors rated importance from "very important" (5) to "not important" (1) and the adequacy of employees’ actual knowledge and skills from "excellent" (5) to "poor" (1).
Communication skills overall appear most important to alumni's jobs, according to their supervisors, followed by conducting work activities in an ethical manner and attitudes toward work. GPA, technical computer skills, and foreign language skills, on the other hand, are the least important items according to the responding employers. All mean importance ratings except for foreign language skills and technical computer skills had a mean rating of 3.0 or better, indicating that on average employers considered almost all the items as at least moderately important to these jobs.
Most items had mean performance ratings of 4.0 or better, indicating that NC State alumni tend to have "good" knowledge or skill in these areas, compared to other employees. On a few items graduates appear to have an "average" performance level, and they had a slightly less than "average" performance level only on foreign language skills. According to their employers, alumni performed best on the conducting work in an ethical manner (4.6), willingness to accept new responsibilities (4.4), and being dependable, and punctual (4.4) items. Performance on technical computer skills (3.6) and foreign language skills (2.9) received the lowest ratings, in the "average to good" and "average" ranges respectively.
Overall Alumni Preparation
(Table 4-10)A majority of supervisors (55.8%) reported that the NC State alumnus employee was "much better" or "somewhat better" prepared for her/his position than other employees. Just 4 employers (1.1%) reported that the graduate was "somewhat poorer" prepared than her/his co-workers. Almost half (48.8%) of employers reported that the NC State graduate had been promoted.
Table 4-10. Overall Evaluation of Educational Preparation of Employed Alumni
| Mean |
4: Much Better |
3: Somewhat Better |
2: About Same |
1: Somewhat Poorer |
|
|
Graduates’ preparation compared with other employees |
2.27 |
18.8% |
37.0% |
43.2% |
1.1% |
General Knowledge and Skill Categories
(Table 4-11)Supervisors considered 4 of the 8 categories as "important" to "very important," with mean ratings of 4.5 or higher. Almost one-fourth (74.4%) of employers said overall communication skills were "very important". Overall knowledge of computer applications (4.1), and academic background overall (3.8) received the lowest mean ratings for importance. One-third of employers (33.7%) said academic background overall was at best "moderately important" to the alumnus’ position.
Supervisors gave the highest average ratings to alumni performance on professional traits overall (4.4). Using knowledge to solve problems, overall technical knowledge, and overall knowledge of computer applications received the lowest performance ratings in this area (4.1).
Table 4-11. Category Importance and Performance
|
Knowledge/Skill Categories |
Mean |
|
|
(5: high to 1: low) |
||
|
Importance |
Performance |
|
|
Overall communication skills |
4.7 |
4.2 |
|
Work attitudes and skills overall |
4.7 |
4.3 |
|
Professional traits overall |
4.6 |
4.4 |
|
Using knowledge to solve problems |
4.6 |
4.1 |
|
Professional development overall |
4.5 |
4.3 |
|
Overall technical knowledge |
4.3 |
4.1 |
|
Overall knowledge of computer applications |
4.1 |
4.1 |
|
Academic background |
3.8 |
4.2 |
Communication Skills (Table 4-12):
Listening skills received the highest mean importance rating (4.6) among the communication skills, followed by written communication skills (4.4), and reading skills (4.3). Few alumni, according to supervisors, are in positions in which foreign language skills are important. More than three-fourths (79.0%) reported these skills were "of limited importance" at best.
Alumni reading skills (4.3) were rated highest in performance in this category. Ratings were somewhat lower, on average, for their public speaking and presentation skills (3.9) than for other items. Foreign language skills (3.0) received the lowest ratings, with just 14.4 percent of supervisors saying their employee had "excellent" foreign language skills and 19.5 percent rating these skills as "poor".
Table 4-12. Communication Skills Importance and Performance
|
Communication Skills Items |
Mean |
|
|
(5: high to 1: low) |
||
|
Importance |
Performance |
|
|
Listening skills |
4.6 |
4.2 |
|
Written communication skills |
4.4 |
4.1 |
|
Reading skills |
4.3 |
4.3 |
|
Public speaking presentation skills |
4.0 |
3.9 |
|
Foreign language skills |
1.9 |
3.0 |
|
Overall communication skills |
4.7 |
4.2 |
Work Attitudes and Skills (Table 4-13):
Supervisors gave 7 of the 11 work attitudes and skills traits a mean importance rating of 4.5 or higher. Attitudes towards work had the highest ratings (4.7), with 71.0 percent saying it was "very important" to the position. Previous work, volunteer, or internship experience (3.6) received the lowest mean rating. The ability to work with persons from diverse ethnic and cultural backgrounds (4.2) also received a relatively low rating, although it was still considered fairly important. Almost half (47.7%) of the supervisors responding said that this skill was "very important" to the graduate employees' positions.
Supervisors' ratings of employees' performance on areas in the work attitudes and skills category ranged, on average, from 4.4 to 4.0. Previous work, volunteer, or internship experience and making decisions under pressure received the lowest average ratings (4.0). A sizable number of supervisors said their graduate was at best "average" at making decisions under pressure (25.9%) and working under pressure (21.4%).
Table 4-13. Work Attitudes and Skills Importance and Performance
|
Work Attitudes and Skills Items |
Mean |
|
|
(5: high to 1: low) |
||
|
Importance |
Performance |
|
|
Attitude towards work |
4.7 |
4.4 |
|
Carrying out assignments |
4.6 |
4.3 |
|
Being dependable and punctual |
4.6 |
4.4 |
|
Ability adjust new work demands |
4.6 |
4.3 |
|
Working under pressure |
4.5 |
4.1 |
|
Ability to work independently |
4.5 |
4.4 |
|
Ability to work in teams |
4.5 |
4.2 |
|
Making decisions under pressure |
4.4 |
4.0 |
|
Ability to work with persons from diverse backgrounds |
4.2 |
4.4 |
|
Previous work, volunteer, or internship experience |
3.6 |
4.0 |
|
Work attitudes and skills overall |
4.7 |
4.3 |
Professional Traits (Table 4-14):
Each of the five professional trait items was rated as "very important" by a majority of supervisors. Conducting work activities ethically had the highest mean rating (4.7), while confidence in performance had the lowest (4.4).
The majority of supervisors (64.0%) rated the alumnus working for them as "excellent" at conducting work activities in an ethical manner and none received a rating of poor. Confidence in performance and resourcefulness had the lowest mean performance ratings (4.2). Almost one-fourth of employers (23.4%) rated the employee's self-confidence as "average" or worse.
Table 4-14. Professional Traits Importance and Performance
|
Professional Traits Items |
Mean |
|
|
(5: high to 1: low) |
||
|
Importance |
Performance |
|
|
Conducting work activities in an ethical manner |
4.7 |
4.6 |
|
Professionalism |
4.6 |
4.4 |
|
Resourcefulness |
4.5 |
4.2 |
|
Confidence in performance |
4.4 |
4.2 |
|
Professional traits overall |
4.6 |
4.4 |
Using Knowledge to Solve Problems (Table 4-15):
Solving problems was the item in this category rated highest in importance (4.6). 61.2 percent of the respondents indicated that this skill is "very important" to the alumni's jobs. Thinking creatively (50.9%) and defining projects (49.3%) were also rated as "very important" by about half of the employers. Understanding how organizational systems interact was seen as relatively less important (mean=3.9).
Items in this category tended to receive lower mean performance ratings than items in other categories. The most highly rated items in this category (solving problems; thinking creatively; defining projects; and planning projects) had mean ratings of only about 4.0. Understanding how organizational systems interact ranked slightly lower (3.8). In general, however, the majority of NC State graduates’ performance was rated as at least "good" compared to that of employees from other institutions.
Table 4-15. Using Knowledge to Solve Problems Importance and Performance
|
Using knowledge to solve problems Items |
Mean |
|
|
(5: high to 1: low) |
||
|
Importance |
Performance |
|
|
Solving problems |
4.6 |
4.0 |
|
Thinking creatively |
4.4 |
4.0 |
|
Defining problems |
4.4 |
4.0 |
|
Planning projects |
4.3 |
4.0 |
|
Bringing information and ideas together from different areas |
4.1 |
3.9 |
|
Conceptual ability |
4.1 |
3.9 |
|
Understanding how organizational systems interact |
3.9 |
3.8 |
|
Using knowledge to solve problems |
4.6 |
4.1 |
Professional Development (Table 4-16):
Three of four items in the professional development category had mean importance ratings of 4.5 or 4.4. About half of the respondents considered willingness to accept new responsibilities, ability to grow on the job, and ability to learn independently as "very important." Leadership and management skills received the lowest importance rating in this category (4.0).
Alumni’s willingness to accept new responsibilities received the highest performance rating in this category (4.4). Ability to grow on the job and ability to learn independently had only slightly lower average ratings (4.3). A large majority of alumni are considered as having "excellent" or "good" performance on these items. Supervisors gave lower ratings to alumni's performance of leadership and management skills (3.8).
Table 4-16. Professional Development Importance and Performance
|
Professional Development Items |
Mean |
|
|
(5: high to 1: low) |
||
|
Importance |
Performance |
|
|
Willingness to accept new responsibilities |
4.5 |
4.4 |
|
Ability to grow on the job |
4.5 |
4.3 |
|
Ability to learn independently |
4.4 |
4.3 |
|
Leadership and management skills |
4.0 |
3.8 |
|
Professional development overall |
4.5 |
4.3 |
Technical Knowledge (Table 4-17):
Technical knowledge items have slightly lower mean importance ratings than items in the categories mentioned thus far. Basic computer skills was the items rated most highly for importance in this category. Technical computer skills was rated least important (3.0). About 40 percent of the employers said such skills were either "of limited importance" (27.4%) or "not important" (12.5%) for these employees.
Supervisors rated alumni's performance on basic computer skills (4.2) highest on average in this category. Their technical computer skills were not as highly rated (3.6). More than forty percent (42.3%) of supervisors said their employee had at best "average" technical computer skills compared to other employees.
Table 4-17. Technical Knowledge/Computer Skills Importance and Performance
|
Technical Knowledge/Computer Skills |
Mean |
|
|
(5: high to 1: low) |
||
|
Importance |
Performance |
|
|
Basic computer skills |
4.0 |
4.2 |
|
Ability to apply math skills |
3.8 |
4.0 |
|
Ability to apply scientific principles |
3.7 |
3.9 |
|
Technical computer skills |
3.0 |
3.6 |
|
Overall knowledge of computer applications |
4.1 |
4.1 |
|
Overall technical knowledge |
4.3 |
4.1 |
Academic Background (Table 4-18):
Both items in the academic background category had mean importance ratings of less than 4.0. Relevant coursework (3.9) had a higher mean rating than GPA (3.3), which had the third lowest rating of all the items asked about. Only 8.3 percent of employers said GPA was "very important" to the position.
On average alumni are rated as "good" on both GPA and relevant coursework (4.1).
Table 4-18. Academic Background Importance and Performance
|
Academic Background Items |
Mean |
|
|
(5: high to 1: low) |
||
|
Importance |
Performance |
|
|
Relevant coursework |
3.9 |
4.1 |
|
GPA |
3.3 |
4.1 |
|
Academic background |
3.8 |
4.2 |
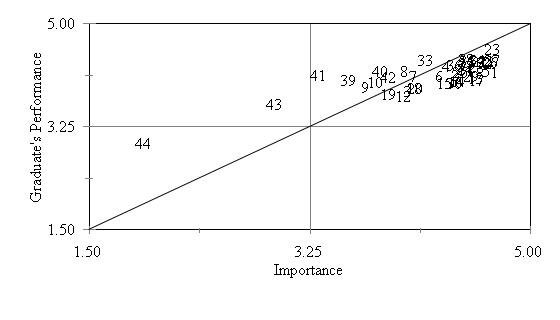
Comparing Skill/Knowledge Item Importance and Performance Mean Ratings (Chart 4-1a and 4-1b)
There is considerable variation in the mean ratings for importance and performance for each knowledge/skill item. These differences reveal potentially important aspects of the supervisors' view of NC State alumni. Charts 4-1a and 4-1b display these differences graphically. Chart 4-1a includes all the knowledge/skill items. Most of the items are grouped in the upper right quadrant of the chart. Items in this quadrant have fairly high mean ratings for both importance and performance, indicating that employed alumni performed well the types of skills and knowledge employers considered important. In general, the items are close to the diagonal that runs from lower left to upper right. Most of the items fall slightly below the diagonal because their mean ratings for importance were slightly higher than their mean ratings for performance. However, the fact that they follow the upward trend of the diagonal indicates that items receiving relatively higher importance ratings also tend to receive relatively higher performance ratings.
The two outlying items in Chart 4-1a are technical computer skills (44) and foreign language skills (43). Employers consider foreign language skills (44) of little importance (mean rating=1.9), and rate alumni’s foreign language skills better (mean=3.0) though still relatively weaker than other skills. Technical computer skills (43) are also considered relatively unimportant for the alumni’s jobs (mean rating=3.0, on the left side of the chart) but their performance in this area is not that different from their performance of other skills (mean=3.6, in the top half of the chart).
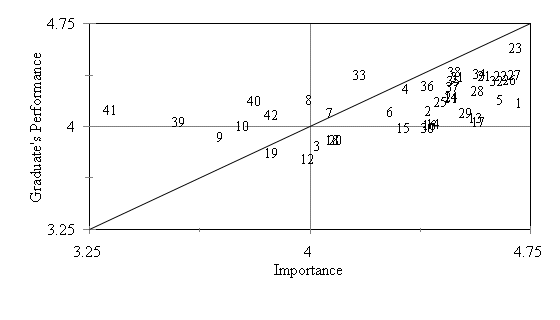
The 42 items clustered in the upper right quadrant of Chart 4-1a have considerable variation among themselves. Chart 4-1b shows this more clearly by dropping the outliers and showing only the items that were in the upper right quadrant of Chart 4-1a. Note that the x and y-axes of Chart 4-1b cover a smaller range than do the axes of Chart 4-1a.1
As with Chart 4-1a, the upper right quadrant of Chart 4-1b contains skill/knowledge items that are rated relatively high in both importance and performance. The types of skills and knowledge falling in this quadrant are those that employers consider important and which they feel alumni performed well. Conducting work activities in an ethical manner (Number 23, Chart 4-1b) is especially noteworthy. The large number of skill/knowledge items falling into this quadrant in Chart 4-1b indicates that alumni tend to perform well on most items considered important to employers. However several items in the lower right corner of this quadrant are rated very high in importance, but have noticeably lower, though still good, mean performance ratings. These include overall communication skills (1), listening skills (5), solving problems (17), and working under pressure (29).
The few skill/knowledge items in the lower left quadrant were rated relatively lower than the other items in both importance and performance. These are items which employers neither feel their employed alumni have performed extremely well nor believe are extremely important. These items include understanding how organizational systems interact (19) and ability to apply scientific principles (9). Chart 4-1a, which displays all the items in Chart 4-1b plus the two additional outlying points, shows that employers also consider foreign language skills (44) relatively less important and less well performed.
Finally, the upper left quadrant contains skill/knowledge items rated moderate in importance but high in performance. Supervisors feel that NC State alumni are relatively well prepared in these areas, but do not see them as extremely important to the alumni's jobs. In Chart 4-1b, the items GPA (41); previous work, volunteer, or internship experience (39); academic background (40); and relevant coursework (42) clearly fall within this quadrant. Chart 4-1a shows that technical computer skills (43) also fits this description.
Summary of Importance/Performance Comparisons:
Overall, the lower right quadrant, which indicates skills and knowledge that employers consider important but alumni perform less well, contains few items in either chart. On the other hand, both charts show that except for the two outliers in Chart 4-1a, the items fall in a fairly narrow horizontal band, indicating that supervisors rate NC State alumni's performance fairly similarly across the various knowledge/skill areas. The supervisor's ratings of the areas' importance, however, cover a wider range. This pattern suggests that while NC State alumni perform the various job tasks fairly well, they are not particularly better at the tasks their supervisors consider relatively more important.
As for the two outlying skill/knowledge items displayed in Chart 4-1a, both may become more important in the near future. As the United States becomes more culturally diversified the importance of foreign language skills will likely increase in many jobs. Similarly, as this society advances technologically the importance of technical computer skills will probably increase as well.
|
1 Overall communication skills |
23 Conducting work activities in an ethical manner |
|
2 Written communication skills |
24 Resourcefulness |
|
3 Public speaking and presentation skills |
25 Self-confidence |
|
4 Reading skills |
26 Work attitudes and skills overall |
|
5 Listening skills |
27 Attitude towards work |
|
6 Overall technical knowledge |
28 Ability adjust new work demands |
|
7 Overall knowledge of computer applications |
29 Working under pressure |
|
8 Basic computer skills |
30 Making decisions under pressure |
|
9 Ability to apply scientific principles |
31 Ability to work independently |
|
10 Ability to apply math skills |
32 Understanding and carrying out assignments |
|
11 Ability to work in teams |
33 Ability work with persons from diverse ethnic/cultural backgrounds |
|
12 Leadership and management skills |
|
|
13 Using knowledge to solve problems overall |
34 Being dependable and punctual |
|
14 Thinking creatively |
35 Professional development overall |
|
15 Planning projects |
36 Ability to learn independently |
|
16 Defining problems |
37 Ability to grow on the job |
|
17 Solving problems |
38 Willingness to accept new responsibilities |
|
18 Conceptual ability overall |
39 Previous work, volunteer, or internship experience |
|
19 Understanding how organizational systems interact |
|
|
40 Academic background |
|
|
20 Bringing information and ideas together from different areas |
41 GPA |
|
42 Relevant coursework |
|
|
21 Professional traits overall |
43 Technical computer skills |
|
22 Professionalism |
44 Foreign language skills |
|
1 Overall communication skills |
22 Professionalism |
|
2 Written communication skills |
23 Conducting work activities in an ethical manner |
|
3 Public speaking and presentation skills |
24 Resourcefulness |
|
4 Reading skills |
25 Self-confidence |
|
5 Listening skills |
26 Work attitudes and skills overall |
|
6 Overall technical knowledge |
27 Attitude towards work |
|
7 Overall knowledge of computer applications |
28 Ability adjust new work demands |
|
8 Basic computer skills |
29 Working under pressure |
|
9 Ability to apply scientific principles |
30 Making decisions under pressure |
|
10 Ability to apply math skills |
31 Ability to work independently |
|
11 Ability to work in teams |
32 Understanding and carrying out assignments |
|
12 Leadership and management skills |
33 Ability work with persons from diverse ethnic/cultural backgrounds |
|
13 Using knowledge to solve problems overall |
|
|
14 Thinking creatively |
34 Being dependable and punctual |
|
15 Planning projects |
35 Professional development overall |
|
16 Defining problems |
36 Ability to learn independently |
|
17 Solving problems |
37 Ability to grow on the job |
|
18 Conceptual ability overall |
38 Willingness to accept new responsibilities |
|
19 Understanding how organizational systems interact |
39 Previous work, volunteer, or internship experience |
|
20 Bringing information and ideas together from different areas |
40 Academic background |
|
41 GPA |
|
|
21 Professional traits overall |
42 Relevant coursework |
Comparisons and Frequencies: Gender/Ethnicity
Back to Top
Download a Microsoft Word Version of this report.
We've named the file .bin so your browser gives you a download
window instead of displaying the file. When you download it you can rename
it to .doc to indicate that it's a Word file.