Table of Contents
This report presents selected results from NC State's 1997 Graduating
Senior Survey. NC State offers a wide variety of university services
to students, including curriculum and instruction, academic advising,
campus resources, and extracurricular opportunities. Graduating
seniors were asked to assess these services in terms of satisfaction
with the quality of services and staff responsiveness.
Survey seniors reported being generally satisfied with the quality
of services at NC State. There were very few differences in satisfaction
by gender or ethnicity.
Respondents also rated most campus staff as at least moderately
responsive to their needs. For those staff rated by more than
50% of the respondents, library staff and campus-sponsored recreational
staff received the highest satisfaction ratings.
Introduction and Methodology
This report presents selected information from the March 1997
survey of spring 1997 graduating seniors at NC State. The responses
analyzed represent 53.4% of the spring 1997 graduating senior
class. Results of Chi-Square tests revealed no significant differences
from the total population of graduating seniors in the areas of
gender or ethnicity at the 0.01 significance level. However, significant
differences were found by academic unit, so caution should
be used when interpreting any comparisons by academic unit because
the results may not generalize to the graduating senior class.
The quantitative data obtained from the 1997 Graduating Senior
Survey were analyzed according to standard statistical methods.
Forced-choice responses were tested to determine whether there
were any significant differences according to students' gender,
ethnicity, and academic unit. Questions with categorical responses
were analyzed using Chi-Square tests, and all questions with numerically
coded responses were analyzed using either T-tests or one-way
analysis of variance (ANOVA) with Duncan's multiple comparison
procedure. The significance level for all analyses was p<0.01.
In addition to the quantitative data, the respondents were also
asked two broad, open-ended questions. The first question asked,
"What are the three most important things NC State could
do to improve the quality of undergraduates' experience here?"
Of the 1,002 survey respondents, 739 (74%) answered this question.
The second open-ended question was more global: "Please share
any general comments about your experiences at NC State or tell
us why you were particularly satisfied/dissatisfied with any aspect
of your education at NC State." For this second question,
416 of the 1,002 respondents (42%) provided answers. Responses
to both open-ended questions were transcribed verbatim, and then
examined for relevant themes. To represent and illustrate themes,
student quotes are included throughout this report. Both open-ended
and forced-choice responses are discussed in conjunction with
each other.
Methodology for Satisfaction Ratings
The quality of student services was measured with two response
options: student satisfaction and staff responsiveness. Student
satisfaction was measured using a four-point scale (4=very satisfied,
3=moderately satisfied, 2=moderately dissatisfied, and 1=very
dissatisfied). Another option (don't know/did not use) allowed
students to indicate if they did not use the service. A similar
four-point scale was used to measure students' perceptions of
staff responsiveness (4=very responsive, 3=moderately responsive,
2=moderately unresponsive, 1=very unresponsive). Another option
(no contact) allowed students to indicate if they did not interact
with staff.
For student satisfaction, respondents marking the "don't
know/did not use" option were removed from further analysis
of that item. Similarly, on the staff responsiveness measure respondents
marking the "no contact" option were also removed from
the analysis for that item. Removing these respondents resulted
in a sample size which varied widely according to the service
provided. On the student services items, the standard deviations
ranged from 0.56 to 1.01. and most items averaged around 0.75.
As shown in Table 1, over 20% of the respondents did not provide
satisfaction or responsiveness ratings for twelve of the student
services; in fact, several items were rated by only a small minority
of students. For example, of the 1002 survey respondents, only
about 10% (n=103) provided satisfaction ratings of the chaplains
cooperative ministry, and less than 5% (n=47) provided responsiveness
ratings. For the twelve items with over 20% non-response, results
should be interpreted cautiously because only a sub-sample of
the student body provided ratings.
Satisfaction with Services
Respondents were asked to rate their satisfaction with the quality
of each service using the previously discussed scale. The thirty-two
student services items were categorized into three areas: academic
advising, academic areas, and non-academic student services. This
section discusses each of these areas.
Academic Advising
The importance of academic advising was emphasized by many students.
One respondent recalled, "My advisor was critical to my success
at school." Another student stressed that "being well-advised
is crucial to a successful college experience." Numerous
comments also indicated that the freshman year was a particularly
critical time for advising. In general, the open-ended comments
indicated that at NC State, students' educational experiences
can be largely shaped by their academic advisors.
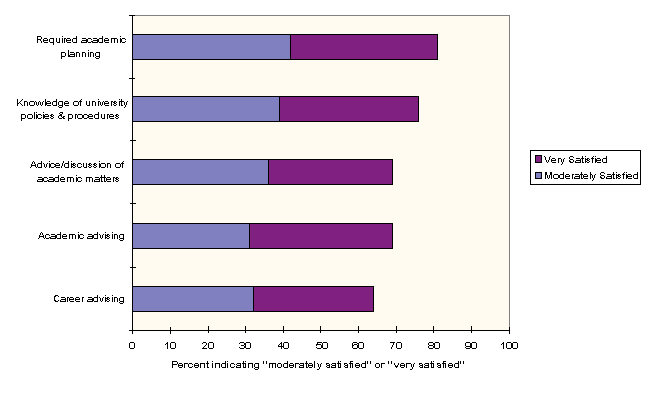
To assess the quality of academic advising, respondents were asked
to rate their satisfaction with the quality of academic advising
overall and with their advisor's abilities in four areas. As shown
in Chart 1, over 2/3 of respondents were moderately or very satisfied
with their academic advising. Advising was rated highest in required
academic planning, and lowest in career advising. There were no
significant differences by gender or ethnicity.
In support of the satisfaction ratings on the five advising items,
many positive advising experiences were recalled in the open-ended
comments. One student said, "I had a really great advisor,
she was very knowledgeable and helpful every time I talked with
her." Another student said, "I had a particularly competent
and caring advisor who was always mindful of my needs and opportunities
for growth/advancement." What makes for good advising? One
student who was "extremely satisfied with my advisor"
recalled that "if my advisor didn't know an answer to a question
he researched it until he did have an answer or knew where to
get one." According to the open-ended comments, students
were most satisfied when advisors "provided excellent support
and information," and were "very responsive and easy
to approach."
Although the majority of students were satisfied with advising,
at least one-fifth of students expressed dissatisfaction with
the experience. One student stated, "My advisor couldn't
have cared less about me or my needs." Another student said,
"The reason I did not graduate on time is that I received
extremely poor advising." Advising was also mentioned by
a student who was otherwise pleased with the NC State: "The
only thing I was really dissatisfied with was the advising experience....
they ran us through like cattle. Finally, a respondent observed
that "Professors seem to have the attitude that advising
is a necessary evil in their jobs. I think it is the most important
because they are helping guide the direction of students' lives."
Of the 739 student comments for improving undergraduate education
at NC State, 160 (22%) recommended improving advising.
To improve academic advising, students suggested "advising
classes for professors" and "ensure that academic advisors
are trained." Another student suggested that NC State "have
advisors trained to answer students' questions and find them an
incentive to do so." While most responses recommended that
professors improve their advising, a few comments suggested that
others might be able to perform this service more effectively.
One student recommended, "Hire people who only advise because
the professors are busy enough and don't have the time."
Another student said, "This university needs to find a way
to eliminate advising duties for those instructors who do not
have time or can not make time for proper advising." As these
comments suggest, some undergraduates thought that advising at
NC State had much room for improvement.
Academic Areas
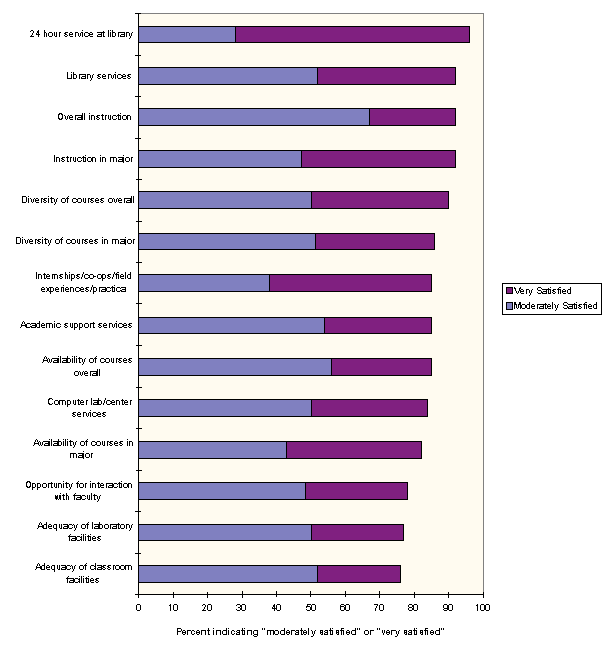
Respondents also rated their satisfaction with the quality of
14 other academic areas. As shown in Chart 2, library services
received the highest rankings: 68% of students indicated they
were very satisfied with the 24 hour library service and 28% were
moderately satisfied. In terms of the quality of overall instruction,
only 25% were very satisfied, but 67% were moderately satisfied.
The lowest satisfaction ratings were received for the adequacy
of laboratory and classroom facilities.
For several of the items under academic areas, significant differences
were found by gender and ethnicity. Compared to males, females
provided significantly higher ratings of overall course diversity
and availability. Females also rated the 24-hour library service
higher than males. In terms of ethnic differences, two of the
academic area items had significant differences by ethnicity.
The diversity of courses overall and the opportunity to participate
in co-curricular activities were both rated higher by whites than
by other minorities.
Classroom instruction
In the open-ended responses, academic areas such as classroom
teaching and instruction were common areas of concern. In the
open-ended responses, there were 739 comments on recommended improvements
and 416 comments on student satisfaction/dissatisfaction. Together,
these questions resulted in a total 1,155 open-ended comments,
173 (15%) of which involved teaching. Although the forced-choice
questions indicated that 92% of respondents were moderately or
very satisfied with the quality of instruction, 78 of the 173
teaching comments indicated that some professors could dramatically
improve their teaching skills. The open-ended responses also revealed
why a small percentage of students were dissatisfied with classroom
instruction.
Some students had difficulty understanding what their instructors
were saying. As one respondent recalled, "One thing I have
run into is teachers who do not speak clear English. This is a
problem for many students. Not only do you have to learn the material,
you have to interpret it too!" Another observed, "Nothing
pisses off students more than getting a bad grade in a class because
they cannot understand the professor." To address this problem,
one recommendation stated that "all instructors should be
able to teach classes in English." Of the 173 teaching comments,
8 indicated that students experienced difficulty understanding
the speech of their classroom instructors.
The quality of instruction was another area of concern. Of the
173 teaching comments, 19 responses were favorable, 76 were neutral,
and 78 were negative. Favorable responses included comments such
as, "Most of my teachers have been wonderful and very helpful,"
and "Teachers were excellent, fair, and understanding."
There were also negative comments: "Many instructors seem
to have immense intelligence but are not very good at teaching,"
and "Some instructors acted like they did not want to teach
undergrads or were to busy to teach at all." The words of
one student captured the mixed views of teaching: "The majority
of professors I had were very knowledgeable, helpful, and intellectually
stimulating. However, I have come across a few that I believe
should not be teaching here." In examining both the forced-choice
and open-ended responses, a clearer picture emerged: most students
seemed to think that although a few professors were poor teachers,
the majority did a good job teaching.
For the small percentage of poor teachers, students urged that
something should be done. One student recommended that "professors
take classes in teaching skills." Another student asked,
"What kind of incentives do you give professors for them
to strive to teach better?" Eleven comments suggested that
revamping or eliminating tenure would make faculty more accountable
to the students they teach. Regardless of tenure or tradition,
students emphasized that they should not be paying money to take
classes from the small percentage of professors who were consistently
rated as poor teachers.
Student evaluations of teachers
Student evaluations of teachers were seen as another way to improve
classroom instruction. Numerous students expressed frustration
over what they perceived as a failure to seriously consider and
act on teaching evaluations. As one respondent asked, "What
is the point of filling out these sheets if they are not taken
seriously?" Another student recommended that NC State "actually
read and listen to students' teacher evaluations." Other
comments included, "Teacher evaluations need to be taken
seriously," and "Make students feel like teacher evaluations
matter." Of the 173 open-ended comments on teaching, 25 recommended
that more attention be paid to students' evaluations of teachers
Students also recommended that observable action follow from the
teacher evaluations. Suggestions included, "Take stronger
action on the input from course evaluations" and "Look
closely at teacher evaluations and act upon how the students respond."
Although students thought that evaluations had the potential to
inform and improve teaching, they sensed that little or no action
resulted from their efforts and thus took a skeptical and cynical
view toward teacher evaluations.
In addition to recommending that evaluations be given more serious
consideration, several comments indicated that fellow students
should have access to teacher evaluations. One respondent said,
"Student evaluations should be made available for other students
to see. We are paying for our education so we should be entitled
to see what we are paying for." Another recommended, "Make
professor evaluations easily accessible and stress to students
that they are available and how to locate them." As these
comments indicate, students believed they had a right to see how
fellow students had evaluated teachers.
Teaching vs. research
Related to concerns about classroom instruction, 29 of the 173
teaching comments raised questions about NC State's teaching vs.
research priorities. As one undergraduate recalled, "It was
disturbing to realize that the primary concern of many professors
is not teaching, as I had initially thought, but research."
Another observed, "Although they may be great researchers,
some professors are not very good at teaching in the classroom."
Other comments were more pointed: "I feel undergrads are
being cheated out of quality teaching for the benefit of graduate
students and the research of professors." In support of this
view, another undergraduate noted that "the unwritten rule
of 'publish or perish' shortchanges the students." Finally,
a student described the relationship between research and teaching:
"As the research load of the professor goes up, the teaching
effectiveness goes down." As these comments suggest, many
undergraduates thought that NC State regarded research as more
important than teaching.
Recognizing these mixed priorities, other students offered a solution:
"The best scenario would be professors who only teach and
those who only do research." Another stated, "Excellence
in teaching should be rewarded just as highly as excellence in
research." Although the large majority of responses did not
question NC State's dual emphasis on teaching and research, 29
of the 173 teaching comments suggested that NC State valued research
more highly than effective classroom instruction.
Non-Academic Student Services
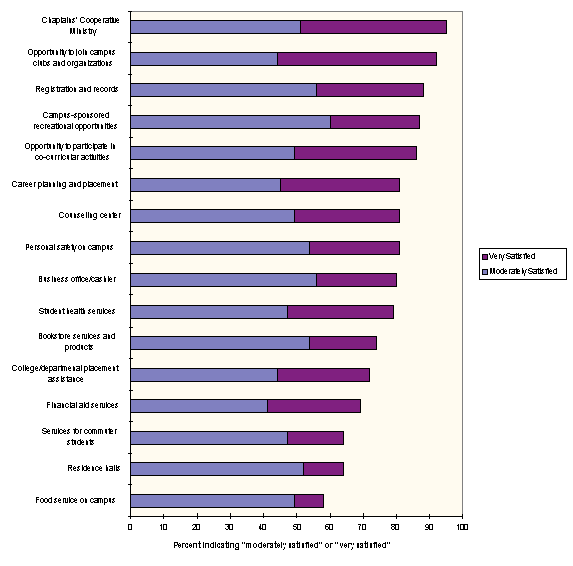
Respondents also rated their satisfaction with non-academic services
such as residence halls, financial aid, and career planning. As
shown earlier in Table 1, the response rate varied widely for
many of these items, and caution should be used in interpreting
satisfaction ratings for those student services with a low response
rate.
Results are displayed in Chart 3. With the exception of food services,
2/3 of respondents were satisfied with the non-academic services.
There were no significant differences by ethnicity, but differences
were found for several items by gender. Compared to males, females
provided higher satisfaction ratings for registration and records
and for bookstore services and products. However, females provided
lower satisfaction ratings in terms of personal safety on campus.
Student awareness of services
Many students indicated that NC State offers a wide variety of
opportunities and services. However, some students expressed disappointment
that, despite the freshman orientation, they did not discover
opportunities until late in their education. Lack of awareness
about some services may be partly responsible for the high degree
of non-response to many of the forced-choice items (see Table
1). One graduating senior suggested, "Make freshman and sophomores
more aware of the opportunities to get involved on campus."
Another said, "Make students keenly aware of all the services
they are paying for so they realize all that they have to take
advantage of." While most comments recommended increasing
the awareness of freshman, a few students said that NC State should
also do a better job of communicating the graduation requirements
to seniors. Of the 739 recommendations for improving undergraduate
education, 30 suggested increasing students' awareness of opportunities
at NC State.
Campus safety
In terms of campus safety, the forced-choice responses indicated
that 80% of students reported feeling moderately or very satisfied
with campus safety. However, females provided significantly lower
ratings than males, and the open-ended responses indicated that
a small minority of students were very dissatisfied. Of the 739
open-ended comments, 31 students (4%) expressed dissatisfaction
with the level of campus security and personal safety. As one
student recalled, "When I recommend classes to my friends,
the No. 1 excuse against night classes is that they would be afraid
to walk the campus at night." Fourteen comments recommended
increasing the lighting on campus after dark.
Parking and transportation
Although the survey did not include questions about parking and
transportation, the open-ended responses revealed that for some
students, these areas were a major source of dissatisfaction.
Eighteen students recommended improving transportation through
Wolfline or monorail, and 74 students recommended better parking.
One student observed that "Parking here is terrible! Build
a deck or monorail... whatever it takes." Another recommended
that NC State "Do something about parking. Currently, stickers
are too expensive and parking tickets are even more expensive."
Similarly, a commuter student bemoaned the parking situation,
saying, "Fighting the city parking police was an annoyance,
but the only other option was to pay an extortionist's sum for
a campus parking permit that did not ensure a decent parking space."
Finally, a student pleaded, "please figure out a better solution
to parking." In all, 92 out of the 739 comments (12%) recommended
improving parking and transportation.
Staff Responsiveness
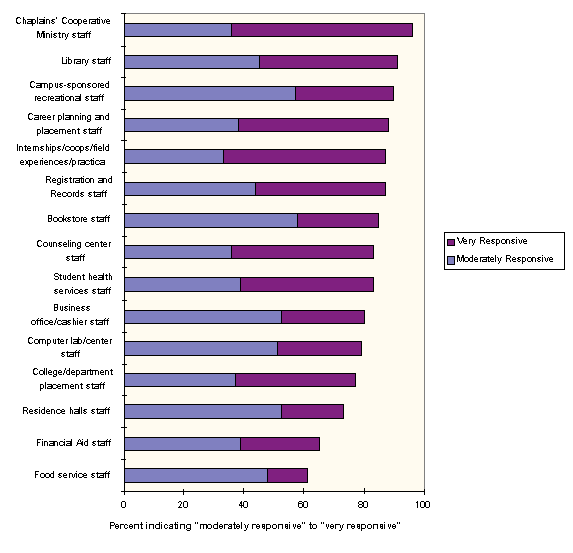
Students often interact with secretaries, tutors, counselors,
office workers, and other university staff. For fifteen campus
services requiring interaction with university personnel, graduating
seniors were asked to rate the responsiveness of university staff
in meeting students' needs. Staff responsiveness was measured
using the previously discussed responsiveness scale. Because
of the high rate of non-response for many of these items, results
should be interpreted cautiously (see Table 1).
Chart 4 displays the percentages of respondents rating staff as
moderately or very responsive. The highest responsiveness ratings
were obtained by staff at the chaplains' cooperative ministry,
campus-sponsored recreations, and the library. Financial aid and
food services received the lowest responsiveness ratings. For
the responsiveness items, there were no significant differences
by ethnicity, and only one difference by gender: compared to males,
females provided higher ratings on the responsiveness of staff
at computer lab/centers.
Summary
Chaplains cooperative ministry
Counseling center
Internships/co-ops/field experiences/practica
Services for commuter students
Campus-sponsored recreational opportunities
Financial aid services
Academic support services
College/departmental placement assistance
Residence halls
Opportunity to participate in co-curricular activities
Food service on campus
Career planning and placement