![[- NC State University -]](https://report.isa.ncsu.edu/Survey/images/ban_logo.gif)
North Carolina State University
1998 Graduating Senior Survey:
Campus Climate
![[- NC State University -]](https://report.isa.ncsu.edu/Survey/images/ban_logo.gif)
North Carolina State University
1998 Graduating Senior Survey:
Campus Climate
This report presents selected results from NC State�s 1998 Graduating Senior Survey. Graduating seniors were asked to assess the supportiveness or discriminatory nature of campus climate.
Introduction and Methodology
This report presents selected information from the March 1998 survey of spring 1998 graduating seniors at NC State. The responses analyzed represent 53.9% of the population of those seniors who were enrolled in the spring 1998 semester and had applied to graduate as of March 30, 1998.
Chi-square tests (p £ 0.01) for samples representative of gender, ethnicity, and academic unit revealed no significant differences between survey respondents and the senior population as a whole.
The quantitative data obtained from the 1998 Graduating Senior Survey were analyzed according to standard statistical methods. Questions with categorical responses were analyzed using chi-square tests, and all questions with numerically coded responses were analyzed using either t-tests or one-way analysis of variance (ANOVA) with Duncan�s multiple comparison procedure. The significance level for all analyses was p<0.01. Analyses were calculated omitting responses of "don�t know" and "did not use" to portray the most accurate picture of students� attitudes and opinions.
In addition to the quantitative data, the respondents were also asked two broad, open-ended questions. Responses to both open-ended questions were transcribed verbatim, and then examined for relevant themes. To represent and illustrate themes, student quotes are included throughout this and the other reports. Both open-ended and forced-choice responses are discussed in conjunction with each other.
Campus Climate for Student Sub-groups
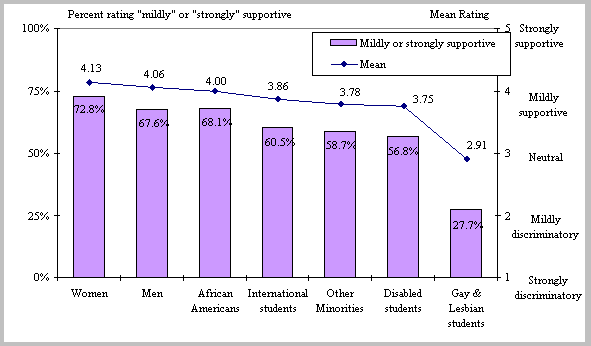
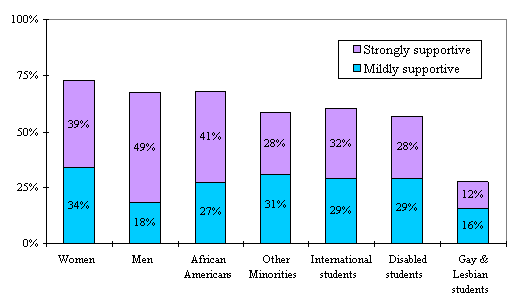
Graduating seniors were asked to assess the supportiveness or discriminatory nature of campus climate using a five-point scale (5="strongly supportive" to 1="strongly discriminatory"). As shown in the charts below, the campus climate was seen as the most supportive of women and least supportive of gays and lesbians.
There were significant differences by ethnicity and gender. Significantly more women felt that the campus climate was positively supportive of men. Significantly more whites felt that that the campus climate was positively supportive of African Americans, other ethnic minorities, and international students. There were also significant differences by academic unit. Students in the School of Design (Design) indicated that they felt that the campus climate was significantly less supportive of women, gays and lesbians and other minorities.
Campus climate issues also appeared in responses to the open-ended questions. Some students suggested that the university should concentrate on all students, not just minorities. Others expressed disappointment as to the blatant discrimination of minorities.
Chart 1: Campus Climate for Student Sub-groups

Chart 2: Campus Climate: Supportiveness

Students Disagreeing That Racial Conflict and Lack of Respect Are Prevalent
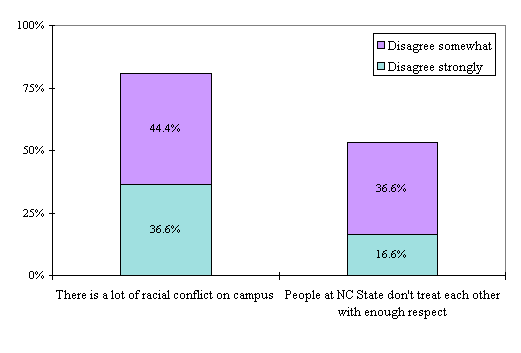
Graduating seniors were asked their opinion on the prevalence of racial conflict and lack of respect for others. The majority of respondents (81%) disagreed that racial conflict was prevalent on campus, however nearly half of the respondents felt that people at NC State don�t treat each other with enough respect. There were significant differences by gender and ethnicity. Significantly more women than men felt that there was a lot of racial conflict on campus. Significantly more African Americans than other minorities and whites felt that racial conflict and lack of respect were prevalent on campus. There were also significant differences by academic units. All of the colleges/schools, with the exception of Design students, disagreed that people don�t treat each other with enough respect.
Chart 3: Disagreement that Racial Conflict
and Lack of Respect are Prevalent

NC State�s Commitment to Helping Minorities Students Succeed
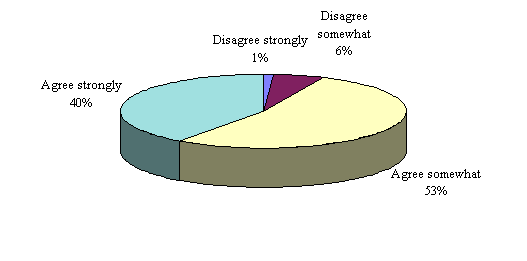
Graduating seniors were asked whether they felt that NC State was committed to helping minority students succeed. Overwhelmingly, the majority (93%) agreed that NC State was committed to helping minority students succeed. There were significant differences by gender and ethnicity. Significantly more males than females and significantly more whites than African Americans and other minorities felt that NC State was committed to helping minority students succeed. There were also significant differences by academic unit. Significantly more students in the College of Forest Resources (CFR), the College of Textiles (COT), and the College of Agriculture and Life Sciences (CALS) felt that NC State is committed to helping minorities succeed.
Chart 4: NC State is Committed to Helping Minority Students Succeed

 Tables by Gender/Ethnicity
 Tables by Academic Unit